Thoughts
- Measure the co-integration z-score in order to detect for SGX trading signals
- Will an SGX product with a monthly frequency be forthcoming?
- Potentially Compare with the ACCC Netback Price Series for a more holistic view of the USEP.
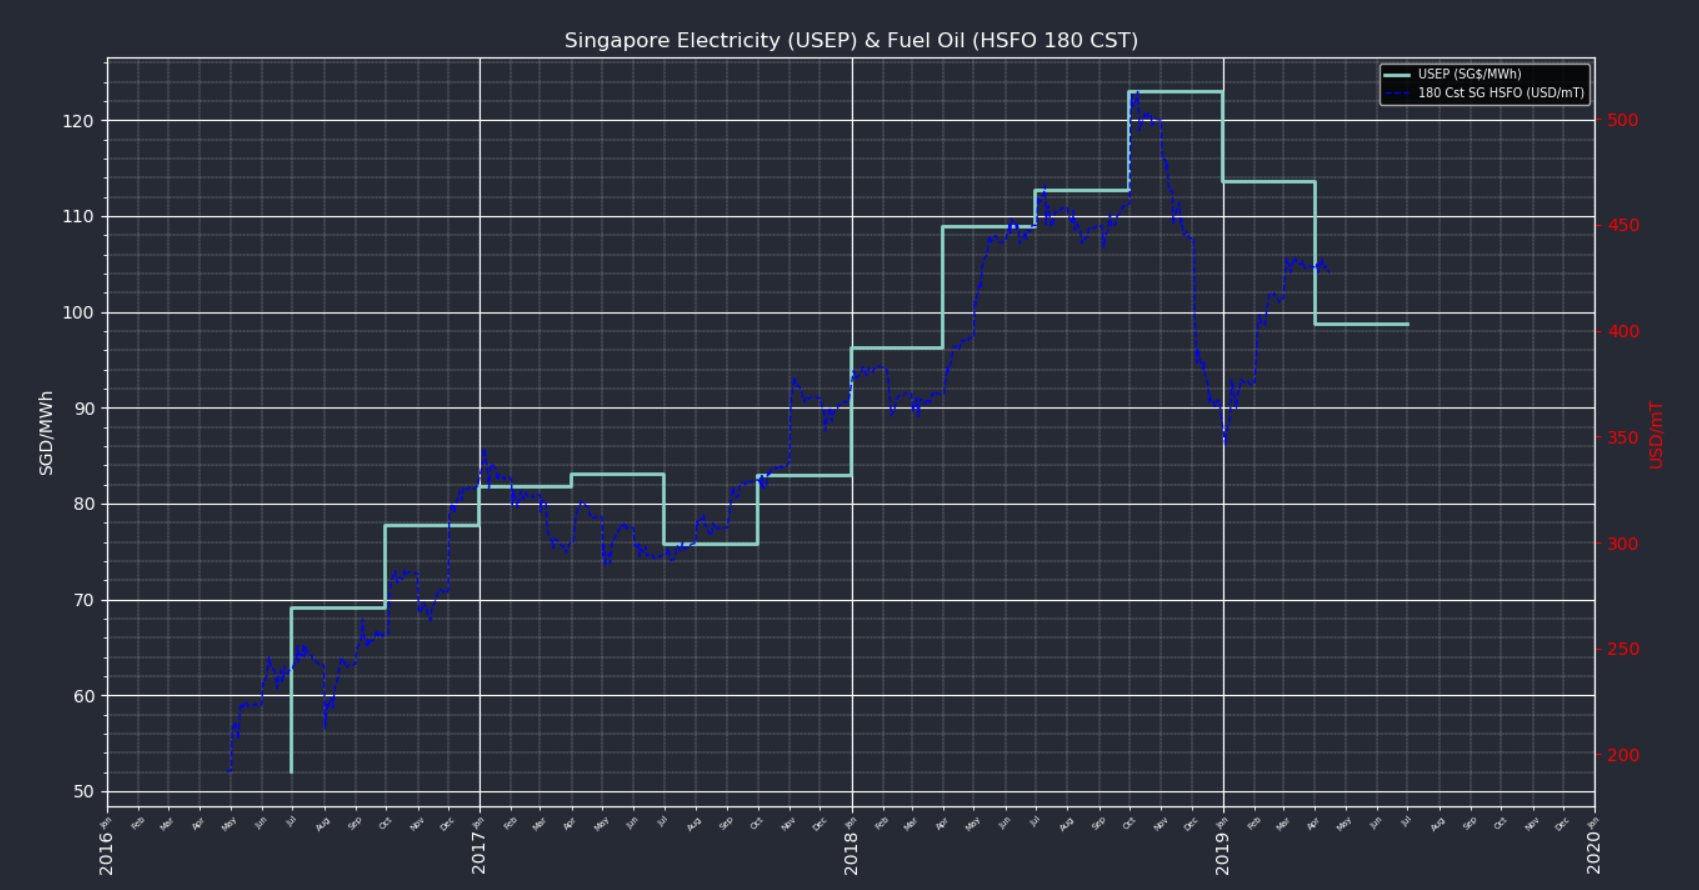
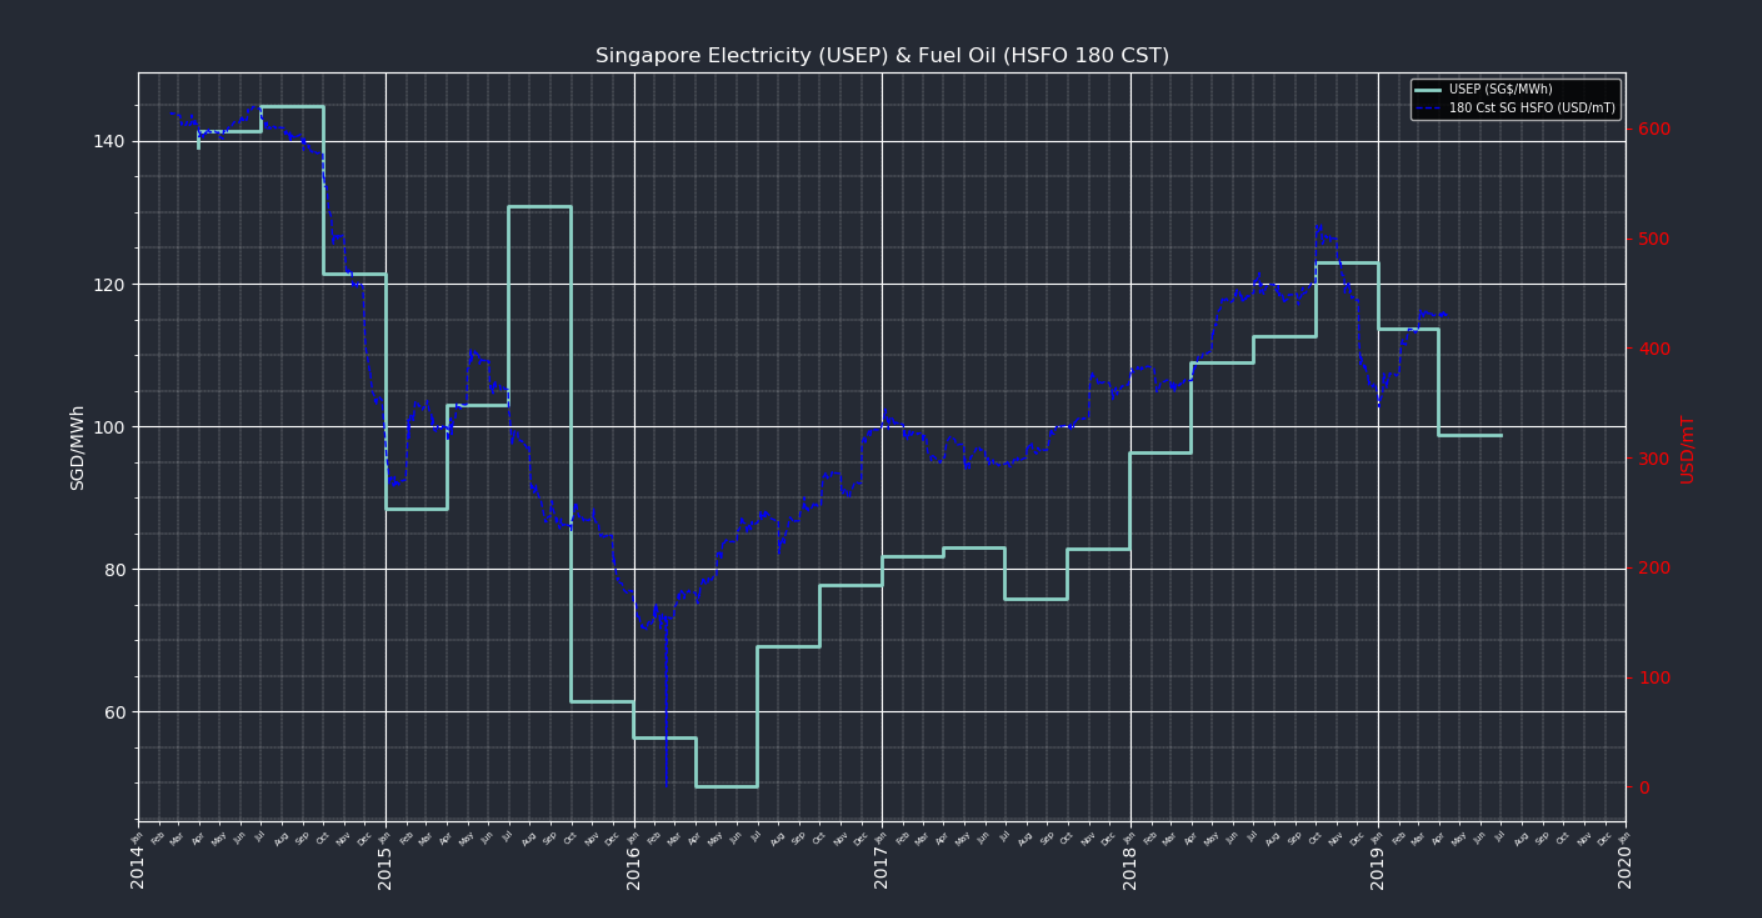
A 5-Year view of the USEP historical Prices vs 180 Cst Fuel Oil Shows that the 180Cst futures price leads the NEM USEP:
Code
#Imports
import pandas as pd
import quandl
from common import common as c

#Define Time Period
begtime_str = '2016-04-28'
endtime_str = '2019-04-15'

#Get Fuel Oil from Quandl
fuelOil = quandl.get("CHRIS/CME_UA1",start_date=begtime_str,end_date=endtime_str, authtoken="<AUTH KEY HERE>")
fuelOil.rename(columns={'Settle':'180 Cst SG HSFO (USD/mT)'},inplace=True)

#retrieve USEP from previously-saved-file (or use Energy Trading API Wrapper)
df = pd.read_csv("2016to2019USEP.csv",index_col=0)
df = df[(df.index > begtime_str) & (df.index <= endtime_str)]

#get daily and quarterly averages
df.index = df.index.astype('datetime64[ns]')
pd.to_datetime(df.index)
df['dt'] = df.index.values
df['dt'] = df['dt'].astype('datetime64[ns]')
df_daily = df.groupby([df['dt'].dt.date]).mean()
df_daily.index = pd.to_datetime(df_daily.index)
df_qtr = df_daily.resample('Q').mean()
df_qtr.rename(columns={'USEP ($/MWh)':'USEP (SG$/MWh)'},inplace=True)
axis2DF = fuelOil
axis1DF =df_qtr

#Plot records
c.plot2axis2DFUSEP(axis1DF,axis2DF
              ,pltTitle="Singapore Electricity (USEP) & Fuel Oil (HSFO 180 CST)"
              ,ax1_label="SGD/MWh"
              ,ax2_label="USD/mT"
              ,ax2_list = ["180 Cst SG HSFO (USD/mT)"]
              ,ax1_list = ["USEP (SG$/MWh)"]
              )

