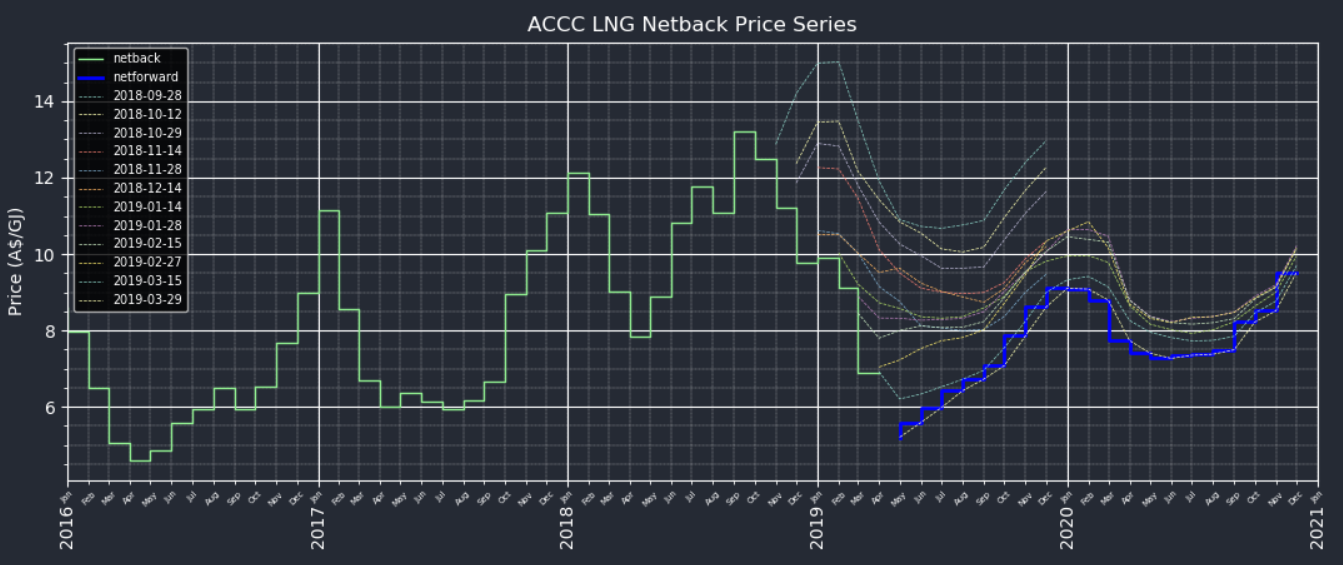
Drifting Downwards, but mean-reverting.
ACCC Netback Price Series
A day before the ACCC releases the 14th iteration of the fortnightly-updated Netback Price Series, I’m sharing this chart that shows the behaviour of the “Netback Price Forward” since the index’s inception in October 2018.
The behaviour clearly shows how the recent collapse of the JKM has driven down the netback price. The “net forward” series however shows a reversion to a long-term mean.
API Information
Github
Pypi
- PyPi Project Page
- pip install energy-trading-api
Code
from energy_trading_api import australiaLNG
import pandas as pd
import matplotlib.pyplot as plt
from matplotlib.ticker import (MultipleLocator, FormatStrFormatter,AutoMinorLocator)
import matplotlib.dates as mdates
import numpy as np
netback,netforward,merged = australiaLNG.acccNetbackPrice()

# get rounded datemin/datemax based on these records
datemin = np.datetime64(merged.index[0], 'Y')
datemax = np.datetime64(merged.index[-1], 'Y') + np.timedelta64(1, 'Y')


#PLOTTING
plt.style.use('dark_background')
fig, ax1 = plt.subplots(facecolor='#252a34')
ax1.set_facecolor('#252a34')
ax1.set_xlim(datemin, datemax)
#Major/Minor Gridlines
minorLocator = AutoMinorLocator()
ax1.yaxis.set_minor_locator(minorLocator)
plt.grid(b=True, which='major', linestyle='-')
plt.grid(b=True, which='minor', linestyle='--',linewidth=0.2)

#TICKS
plt.tick_params(axis='both', which='major', labelsize=10)
years = mdates.YearLocator()   # every year
months = mdates.MonthLocator()  # every month
days = mdates.DayLocator() #every day
yearsFmt = mdates.DateFormatter('%Y')
monthsFmt = mdates.DateFormatter('%b')
# format the ticks
ax1.xaxis.set_major_locator(years)
ax1.xaxis.set_major_formatter(yearsFmt)
ax1.xaxis.set_minor_locator(months)
ax1.xaxis.set_minor_formatter(monthsFmt)
ax1.tick_params(axis='x', which='major', rotation=90, pad = 10)
ax1.tick_params(axis='x', which='minor', rotation=45, labelsize=5)
#Labels
plt.plot(label='Inline label')
plt.xticks( rotation='vertical')
plt.subplots_adjust(bottom=0.15)

ax1.set_ylabel('Price (A$/GJ)')
l1 = ax1.step( x=netback.index,y=netback,linewidth=1, label='netback',color='lightgreen')
# l2 = ax1.plot( netforward,linewidth=2, label='netforward')


url = f"https://www.accc.gov.au/system/files/LNG%20netback%20price%20series%20-%20Public%20version%20-%201%20April%202019.xlsx"
df = pd.read_excel(url,index_col =1,sheet_name='Price series chart data',skiprows=4)
df_columns = df.columns
# print(df[3:4].to_string())
# df = df[3:]
df.index.rename('Delivery Month',inplace=True)
df = df.drop("Unnamed: 0",axis=1)
df.columns = df.columns.astype(str)

l2 = ax1.step(x=netforward.index, y=netforward,linewidth=2, label='netforward', color='blue')

date_list = ["2018-09-28 00:00:00"         ,"2018-10-12 00:00:00","2018-10-29 00:00:00","2018-11-14 00:00:00","2018-11-28 00:00:00"
             ,"2018-12-14 00:00:00","2019-01-14 00:00:00", "2019-01-28 00:00:00","2019-02-15 00:00:00","2019-02-27 00:00:00","2019-03-15 00:00:00"
             ,"2019-03-29 00:00:00" ]
lines = l1+l2

for x in date_list:
    df[x]=df[x].dropna()
    l = ax1.plot(df[x]  ,linewidth=.5, linestyle='--', label=x[:10])
    lines = lines+l


labels = [l.get_label() for l in lines]
ax1.legend(lines, labels,fontsize="x-small")
plt.title("ACCC LNG Netback Price Series")
plt.show()

